My Water Usage Follows Normal Distribution

I have been collecting water usage data for three years. The way home-assistant collects data, I get hourly mean, mix and max values for the water level in a sqlite database.
Raw Numbers
To set the context:
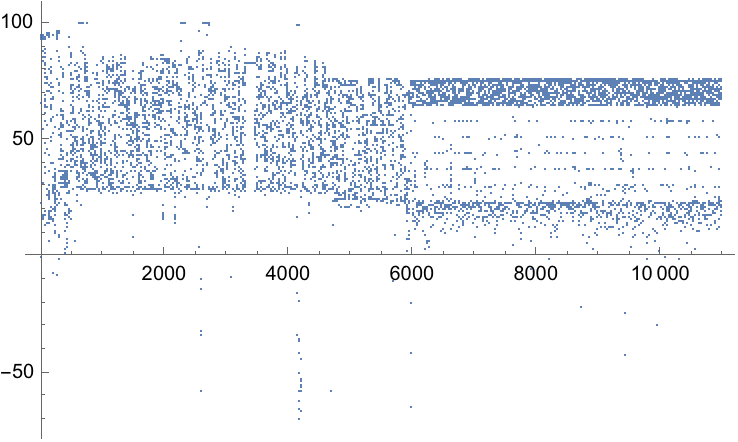
- Total data points: 13,410
- Range of Values: 0.05 - 99.93
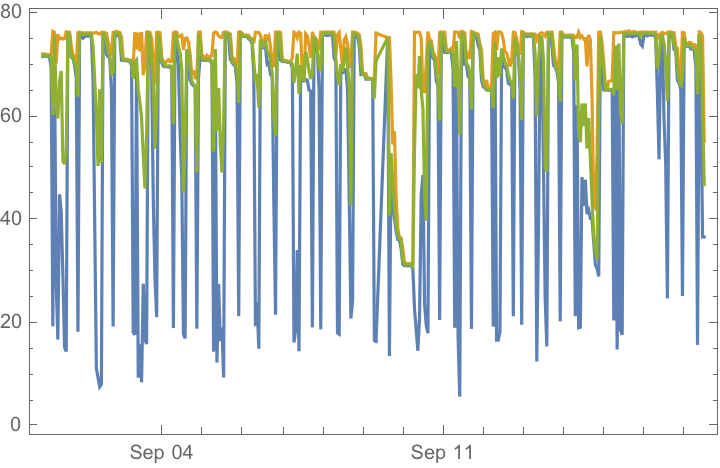
Plot of all the points:
Cleanup
Negative values come from malfunctioning sensors. A lot of jitter from earlier sensors as well. Cleaning up negative values, assuming they’re sensor noise, here is a plot of data from 2021:
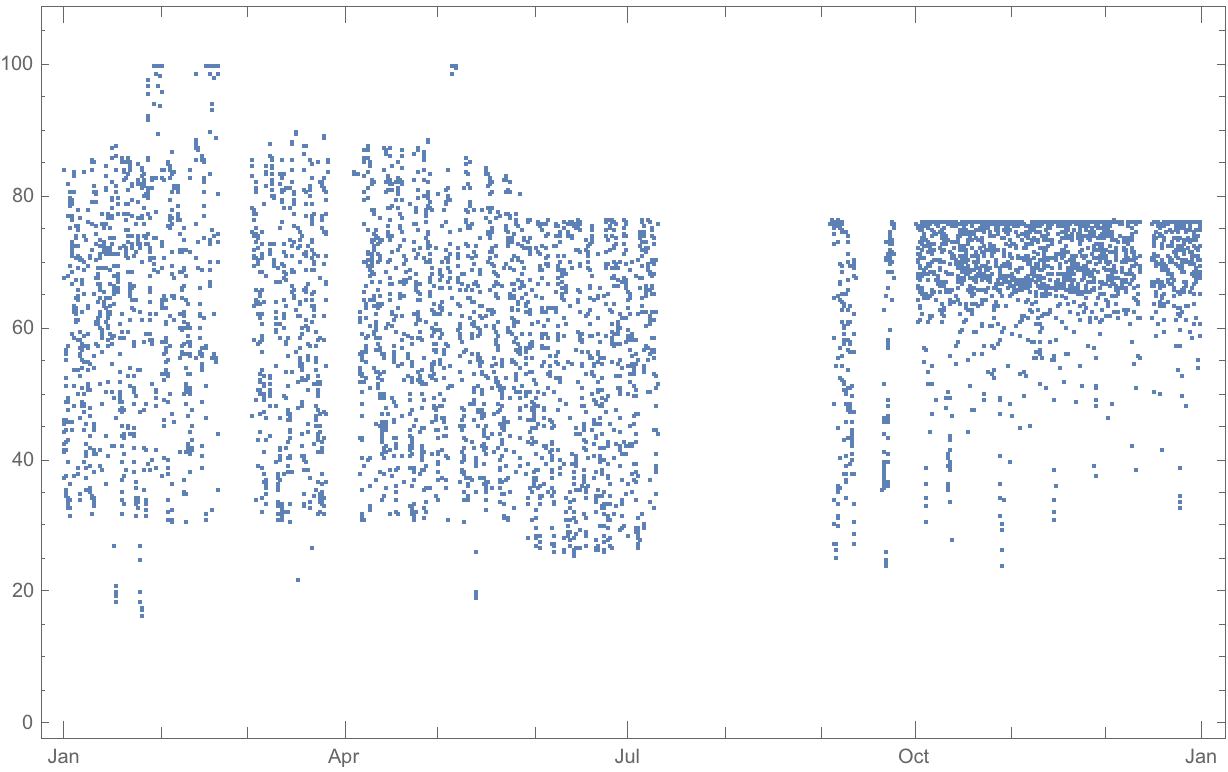
You might notice four conspicuous gaps in the dataset. The first two correspond to periods when I was tinkering with different sensors to improve system accuracy. The large gap in August-September was due to system failure during the rainy season. This event led me to thoroughly waterproof the sensor setup, resulting in visibly more consistent data collection thereafter.
Patterns
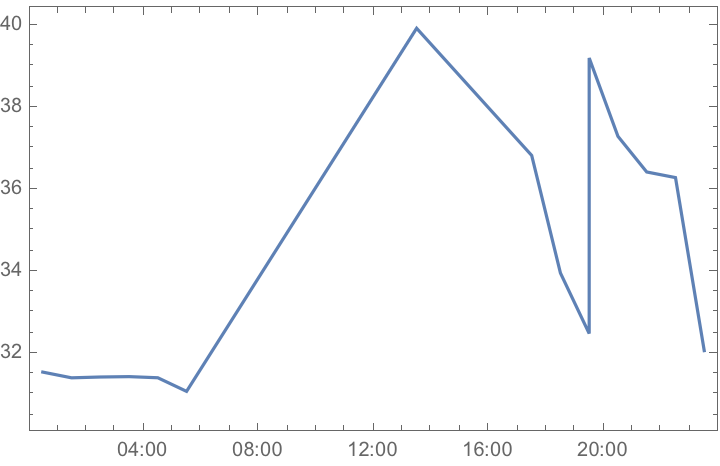
To understand usage patterns, the following plot is mean values from Sept’23:
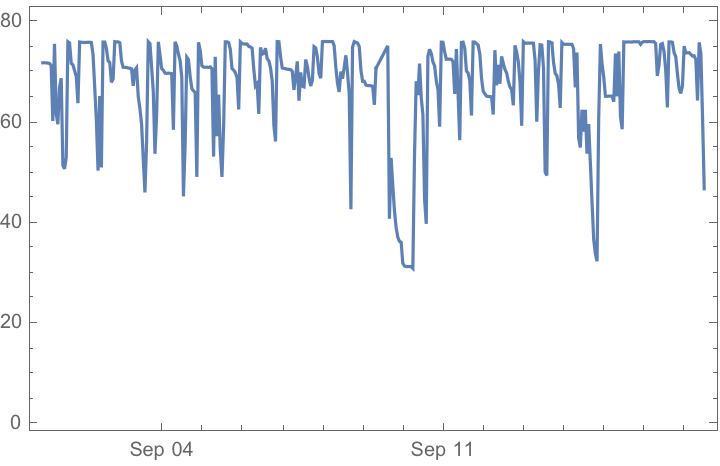
And this is Min, Mean, Max:
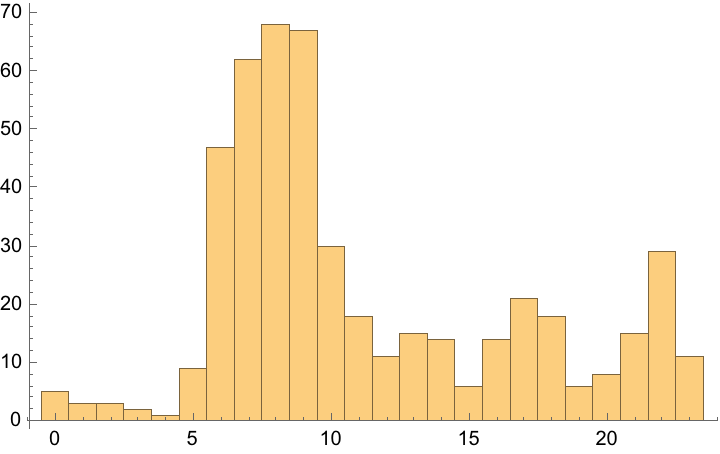
To see the pattern more clearly, here is a plot of mean values bucketed by hour through the month of Sept’23
Key observations:
- Water usage dips early in the morning when the family wakes up.
- Another dip occurs around 20:00, signaling the family’s transition to winding down for the day.
Further insights can be derived from a histogram focusing on readings below 30:
Normal Distribution
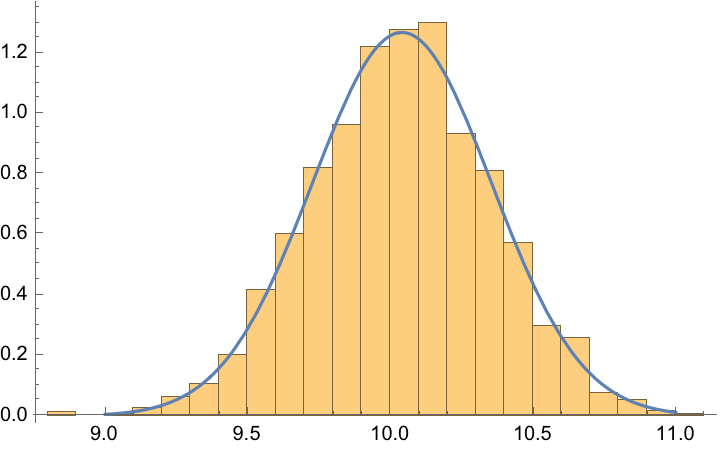
Taking 1000 random samples out of total data for mean values, for 10000 times gives us the nice bell curve!
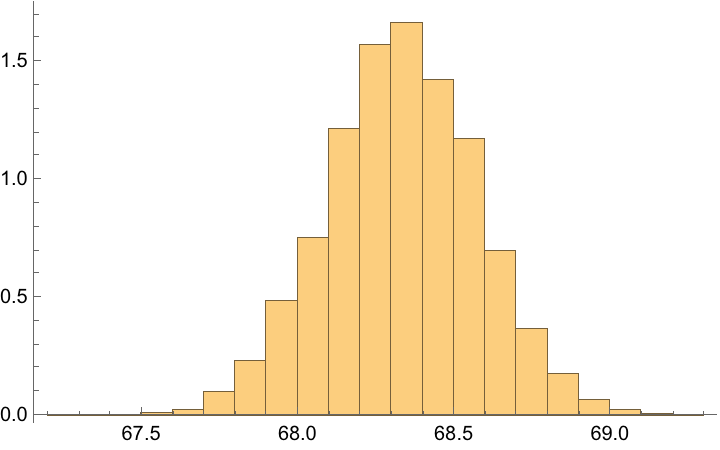
When compared with a standard Normal Distribution curve, the resemblance is uncanny:
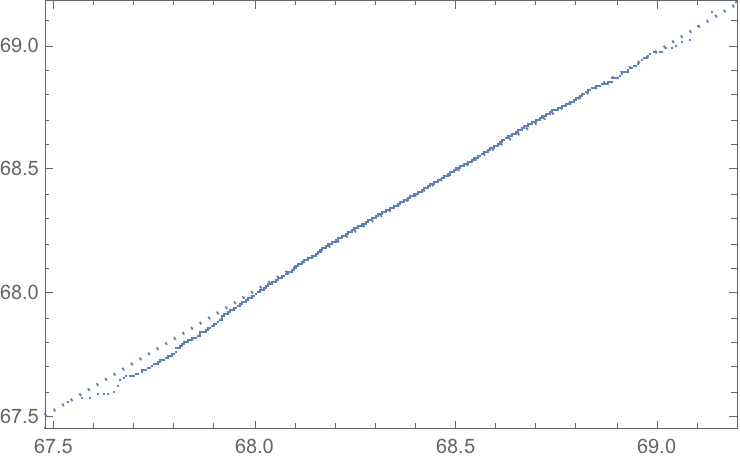
To verify if the distribution really follows Normal Distribution, we can check it with Quantile-Quantile Plot showing strong correlation:
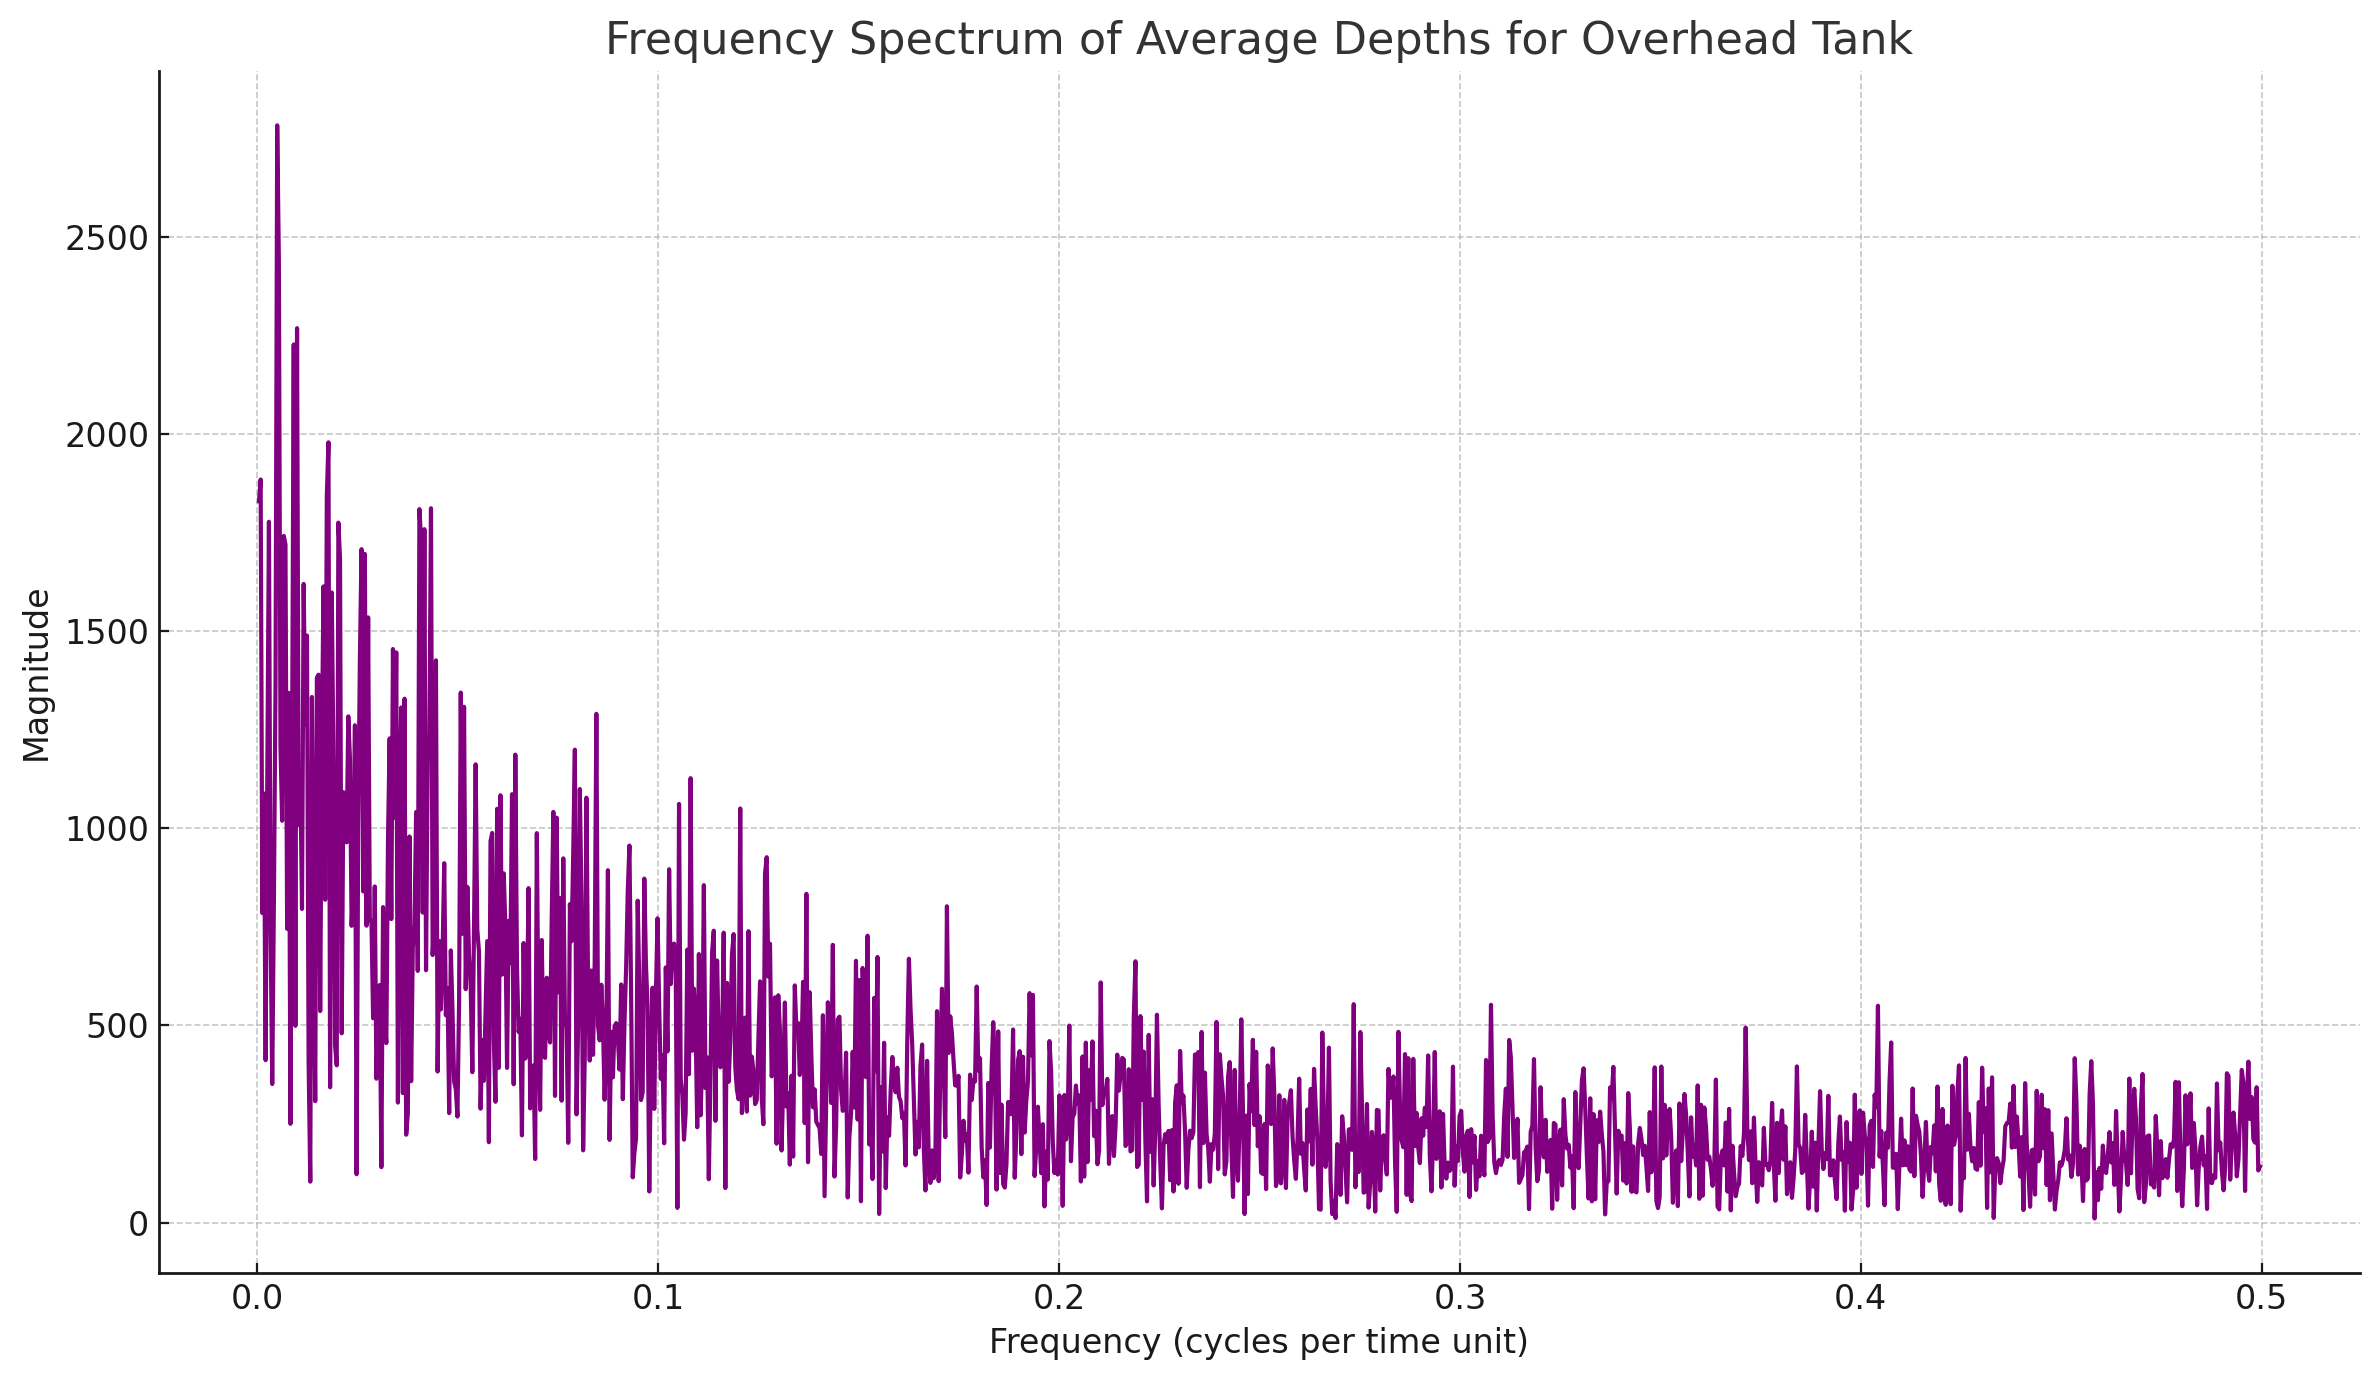
Bonus: Frequency Spectrum Analysis
I conducted a frequency spectrum analysis to look for any recurring patterns or cycles in water usage: